The GBFC has gathered some useful infographics that can offer some insight into how your business benefits from being accessible.
Infographics
Technology related barriers

Text description: Technology related barriers
Most common types of technological devices used by persons with disabilities or long-term conditions in 2024Note1, Note2, Note3
- 86%: Mobile or smartphones
- 53%: Laptop or netbook
- 41%: Desktop computer
Women (50%) were more likely than men (40%) to have difficulties using a technological device because of their condition.
Among persons with disabilities or long-term conditions…
- 29% experienced difficulties while using their mobile or smartphone because of their condition
- Most common types of difficulties
- 12%: Downloading or installing programs or applications
- 11%: Operating a touchscreen (e.g., screen too small, no alternative)
- 10%: Manipulating controls (e.g., size or spacing of button or dial, lack of tactile indicators or braille controls)
25% experienced difficulties using online communication toolsNote4 because of their condition
- Most common types of difficulties
- 10%: Lack of adjustable settings
- 10%: Accessing support services for communication tools
- 9%: Time limits to completing actions on communication tools
30% experienced difficulties while using self-serve technologyNote5 because of their condition
- Most common types of difficulties
- 15%: Lack of human assistance when needed
- 13%: Reading on-screen text
- 12%: Understanding on-screen prompts
Source: Statistics Canada, Survey Series on Accessibility – Experiences with Accessibility and Information and Communication Technology, 2024.
Note
Footnote 1.
The population covered by the Survey Series on Accessibility – Experiences with Accessibility and Information and Communication Technology (SSA-EAICT) comprised those who participated in the 2022 Canadian Survey on Disability and who agreed to participate in future surveys. A series of screening questions was asked in the SSA-EAICT to confirm a disability or long-term condition among participants. Only those who had a disability or long-term condition at the time of collection were surveyed.
Footnote 2.
Respondents were asked whether they had used information and communication technologies in the three months preceding the survey and had experienced any related barriers.
Footnote 3.
Estimates in this infographic include non-responses cases and may differ from estimates in other similar Statistics Canada products.
Footnote 4.
Online communication-related activities include any activities using tools such as Outlook, Gmail, WhatsApp, Facebook, Skype, Zoom or MS Teams.
Footnote 5.
Self-serve technology includes automated teller machines (ATMs), building directories, digital signage, parking payment machines, self-checkout kiosks, etc.
Accessibility is good for business
Text description: Accessibility is good for business
Ontario Ministry for Seniors and Accessibility
Ontario
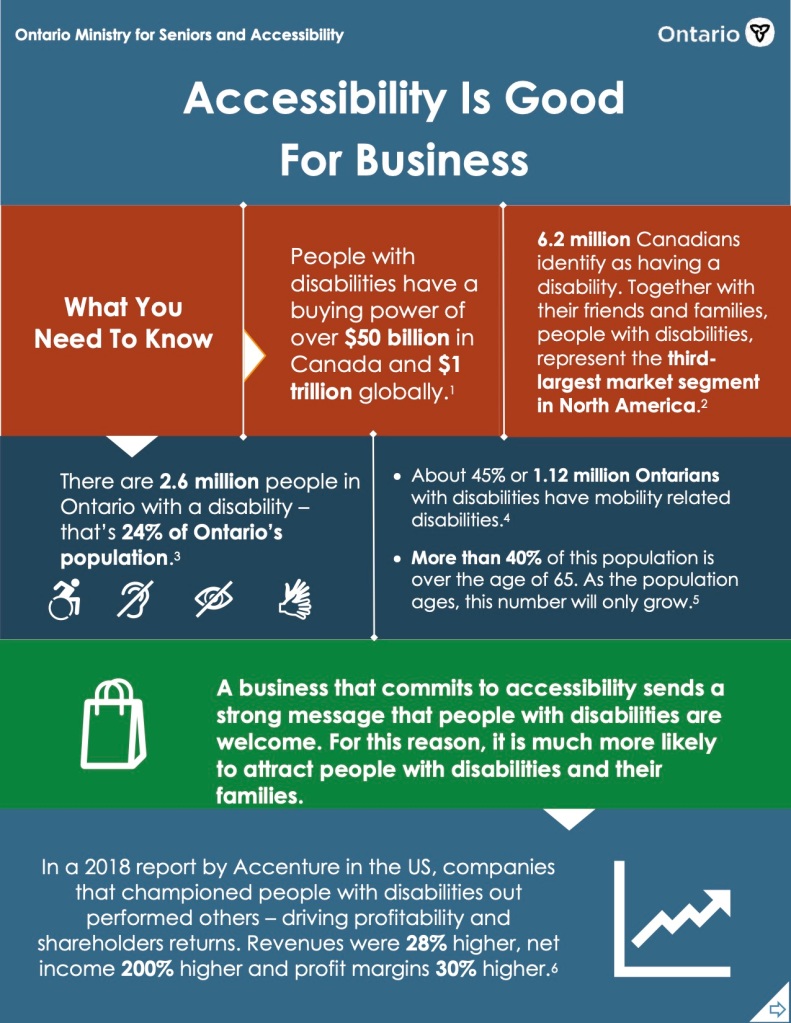
Accessibility Is Good For Business
What You Need To Know
People with disabilities have a buying power of over $50 billion in Canada and $1 trillion globally.¹
6.2 million Canadians identify as having a disability. Together with their friends and families, people with disabilities represent the third-largest market segment in North America.²
There are 2.6 million people in Ontario with a disability – that’s 24% of Ontario’s population.³
About 45% or 1.12 million Ontarians with disabilities have mobility related disabilities.⁴
More than 40% of this population is over the age of 65. As the population ages, this number will only grow.⁵
A business that commits to accessibility sends a strong message that people with disabilities are welcome. For this reason, it is much more likely to attract people with disabilities and their families.
In a 2018 report by Accenture in the US, companies that championed people with disabilities outperformed others – driving profitability and shareholders returns. Revenues were 28% higher, net income 200% higher and profit margins 30% higher.⁶
Source: Accessibility in Ontario: information for businesses (Ontario.ca)
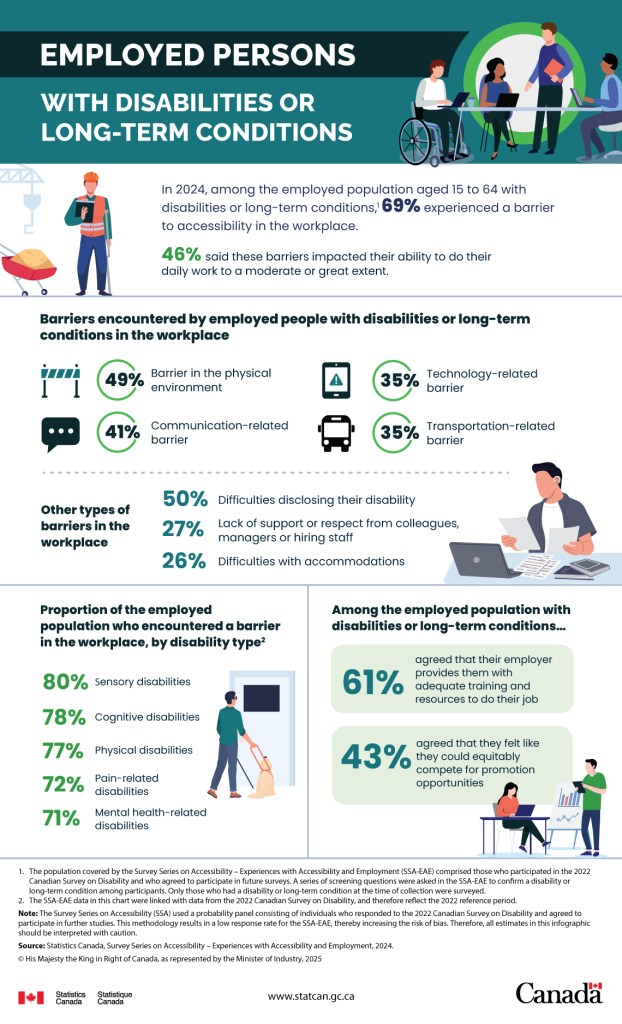
Employed persons with disabilities
Text description: Employed persons with disabilities
In 2024, among the employed population aged 15 to 64 with disabilities or long-term conditions,Note1 69% experienced a barrier to accessibility in the workplace.
46% said these barriers impacted their ability to do their daily work to a moderate or great extent
Barriers encountered by employed people with disabilities or long-term conditions in the workplace
- 49% – barrier in the physical environment
- 41% – communication-related barrier
- 35% – technology-related barrier
- 35% – transportation-related barrier
Other types of barriers in the workplace
- 50% – Difficulties disclosing their disability
- 27% – Lack of support or respect from colleagues, managers or hiring staff
- 26% – Difficulties with accommodations
Proportion of the employed population who encountered a barrier in the workplace, by disability typeNote2
- 80% – Sensory disabilities
- 78% – Cognitive disabilities
- 77% – Physical disabilities
- 72% – Pain-related disabilities
- 71% – Mental health-related disabilities
Among the employed population with disabilities or long-term conditions…
- 61% agreed that their employer provides them with adequate training and resources to do their job
- 43% agreed that they felt like they could equitably compete for promotion opportunities
Note: The Survey Series on Accessibility (SSA) used a probability panel consisting of individuals who responded to the 2022 Canadian Survey on Disability and agreed to participate in further studies. This methodology results in a low response rate for the SSA-EAE, thereby increasing the risk of bias. Therefore, all estimates in this infographic should be interpreted with caution.
Source: Statistics Canada, Survey Series on Accessibility – Experiences with Accessibility and Employment, 2024.
Notes
Footnote 1.
The population covered by the Survey Series on Accessibility – Experiences with Accessibility and Employment (SSA-EAE) comprised those who participated in the 2022 Canadian Survey on Disability (CSD) and who agreed to participate in future surveys. A series of screening questions were asked in the SSA-EAE to confirm a disability or long-term condition among participants. Only those who had a disability or long-term condition at the time of collection were surveyed.
Footnote 2.
The SSA-EAE data in this chart were linked from the 2022 Canadian Survey on Disability and therefore reflect the 2022 reference period.
Source: Statistics Canada: Employed persons with disabilities or long-term conditions
Statistics
Disability in Canada and Ontario
- 1 in 5 Canadians (age 15 or older) identify as having a disability. That’s 6.2 million people!
- In Ontario, that number is 27%. More than 1 in 4 Ontarians.
Customer experience
- Nearly 50% of adults with disabilities say that they avoid businesses with accessibility barriers.
- Word-of-mouth matters: negative accessibility experiences are often shared, impacting business reputation.
Economic impact
- Canadians with disabilities have over $55 billion in discretionary spending power annually.
- Accessibility barriers result in an estimated loss of $16.8 billion annually to the Canadian economy due to unemployment, underemployment, and missed consumer spending.
